|

This is the same
study. It was based on the total intake of children in the real world. There was no intervention, just a look at what the
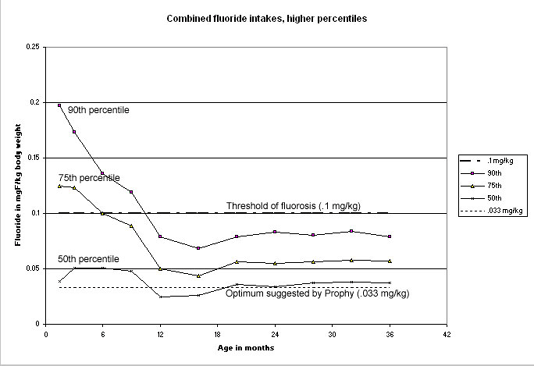
kids got from toothpaste, supplements, and water. (The graph is on all sources.) The study was in Iowa on about 1300 normal
Midwestern children.
My take on this is once again that the average children
(50th percentile line) are pretty close to what we would like to see. (The scale is much larger in this graph.)
(And once again it makes sense that the average children
are OK, as the recommendations most are following are based on the average child. The total optimal intake is still .05 mg/kg,
but that is a little dated. I use .033 mg/kg.)
However, look at the higher percentiles, the 90th and 75th.
These children, especially in first year, are very, very high in fluoride. They are probably over or near the threshold of
fluorosis much of the time.
(These children are not on "tracks" - at least some probably
bounce around. For instance, if a child went from breast feeding to powdered formula in a fluoridated area, he or she could
go from the bottom percentile to the top percentile overnight.) (That high intake shown by the 90th
percentile is not out of line with an average infant on powdered formula mixed with fluoridated water. For an easy example,
a liter of formula is about 1 mg of F when the water is the usual 1 ppm F. For a 5 kg infant that is .2 mg/kg. As formula
fades into solid food and juices, etc., the F intake drops way down.)
Graph data: Levy, SM 2001, unpublished data from the Iowa
Fluoride Study. steven-levy@uiowa.edu
See also Levy SM et al. Patterns of Fluoride Intake from
Birth to 36 Months. J Pub Health Dent 2001. 61(2):70-7.
|


