|
It was Dr. Tom Peebles (now chairman of our company, Prophy Research Corp) who was the first to notice all was not quite well
with this dosage schedule. He noticed many of his patients had white spots on their front teeth.
(These reports
are to this day the best reading in how to use fluoride supplements: Arch Oral Biol 1974; 19:321 and 1978; 23:111. Doses were
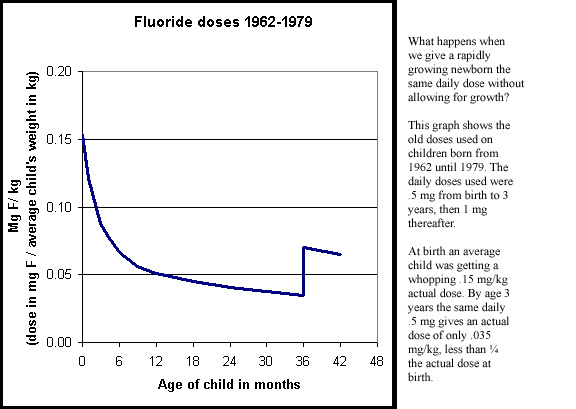
changed in 1979. My focus is on the white spots, because I think today we can prevent them. However, the cavity prevention
of these doses was tremendous: 80%. This was far more important than a few little white spots.)
These results,
and others, helped establish a "threshold of fluorosis" at 0.10 mg F / kg. If teeth are growing, and the dosage
goes over this threshold, white spots will often form.
The next illustration is not critical to understanding
fluoride doses, and you can skip on past if you like. Some of you may enjoy the detail.
How the doses hit the teeth
|